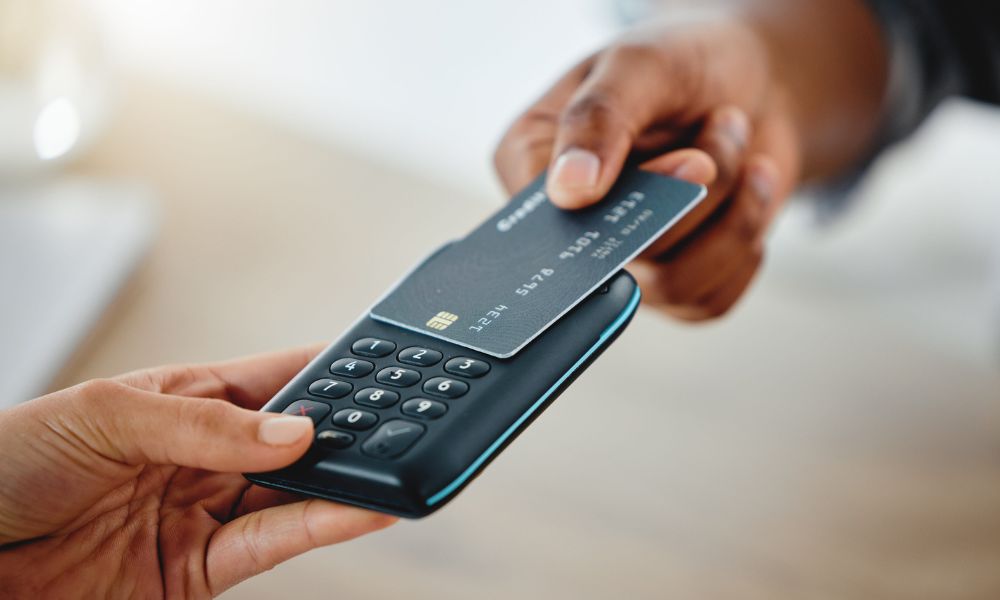
At closing time, a store cash drawer has to match the receipt tape to the penny. On a busy weekend, that used to mean counting a thick stack of bills before anyone went home.
A drawer like that would look thin today. In 2025, credit cards covered 34% of consumer payments in the United States, and cash covered 14%, according to a Pew Research Center analysis of Federal Reserve payment data published September 30, 2026.
Ten years earlier, cash led at 33% and credit cards sat at 18%. Before repeating those numbers, we went back to the original survey to see what they measure, who still pays in cash, and what the shift in how Americans pay means for a household budget.
Where the 34% Figure Comes From
The numbers come from the Diary of Consumer Payment Choice, a Federal Reserve survey run each October. Participants record every payment they make over three assigned days.
The latest round took place in October 2025, according to the Federal Reserve Financial Services release from May 11, 2026, so the report labeled 2026 describes 2025 behavior.
| Year | Cash | Debit card | Credit card | Other methods |
|---|---|---|---|---|
| 2015 | 33% | 29% | 18% | 19% |
| 2019 | 26% | 31% | 24% | 20% |
| 2022 | 17% | 29% | 31% | 22% |
| 2024 | 14% | 30% | 35% | 22% |
| 2025 | 14% | 31% | 34% | 21% |
The shift from cash to cards becomes even clearer when viewed over time. The video below shows how Americans’ payment preferences have changed, with credit cards gradually overtaking cash and debit cards.
View this post on Instagram
Debit cards passed cash in 2018, and credit cards passed debit in 2022.
Card payments of both kinds now account for nearly two out of every three purchases and bills.
The “other” column covers checks, money orders, prepaid and EBT cards, bank transfers, and money stored in payment apps.
Cash Held Steady Last Year
Headlines that say cash “falls to 14%” suggest a fresh drop. Cash was already at 14% in 2024, and credit cards actually slipped a point, from 35% to 34%.
Years of reconciling bank statements at a building-supply company taught me to check the line items before trusting a total.
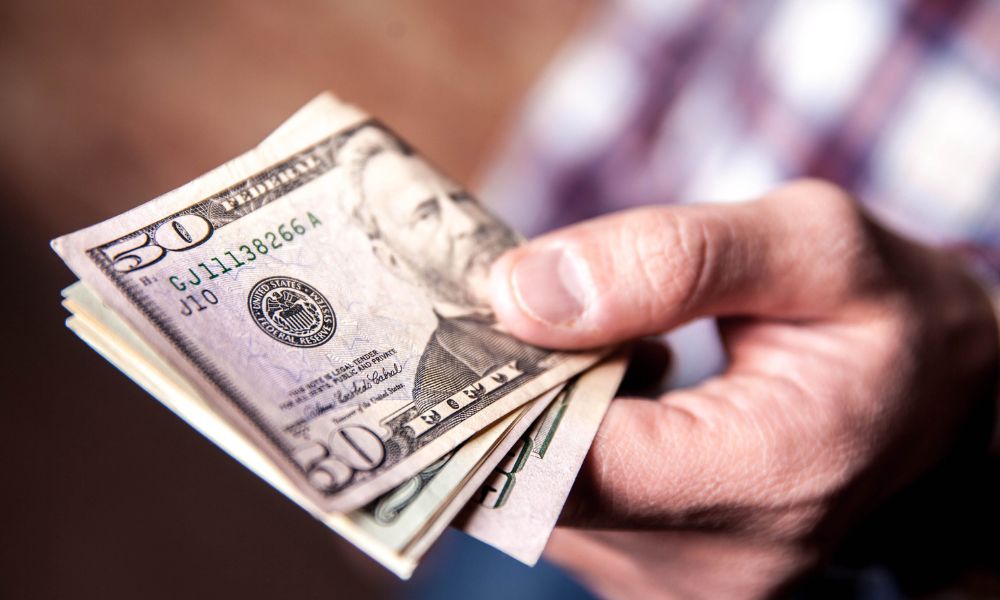
The full 2026 Diary report gives monthly averages. People made 47.3 payments a month in 2025, down from 48.2. Credit card payments eased from 16.64 to 16.14, debit rose from 14.27 to 14.70, and cash slipped from 6.75 to 6.48. Dividing 16.14 by 47.3 gives the same 34%.
A share of payments is a count, not a dollar total. Each purchase or bill counts once regardless of size, so a 34% credit card share means about one in three transactions went on a credit card, not one in three dollars spent.
Who Still Reaches for Cash
Cash use is far from even across the country. The same report shows wide gaps by age, income, and place.
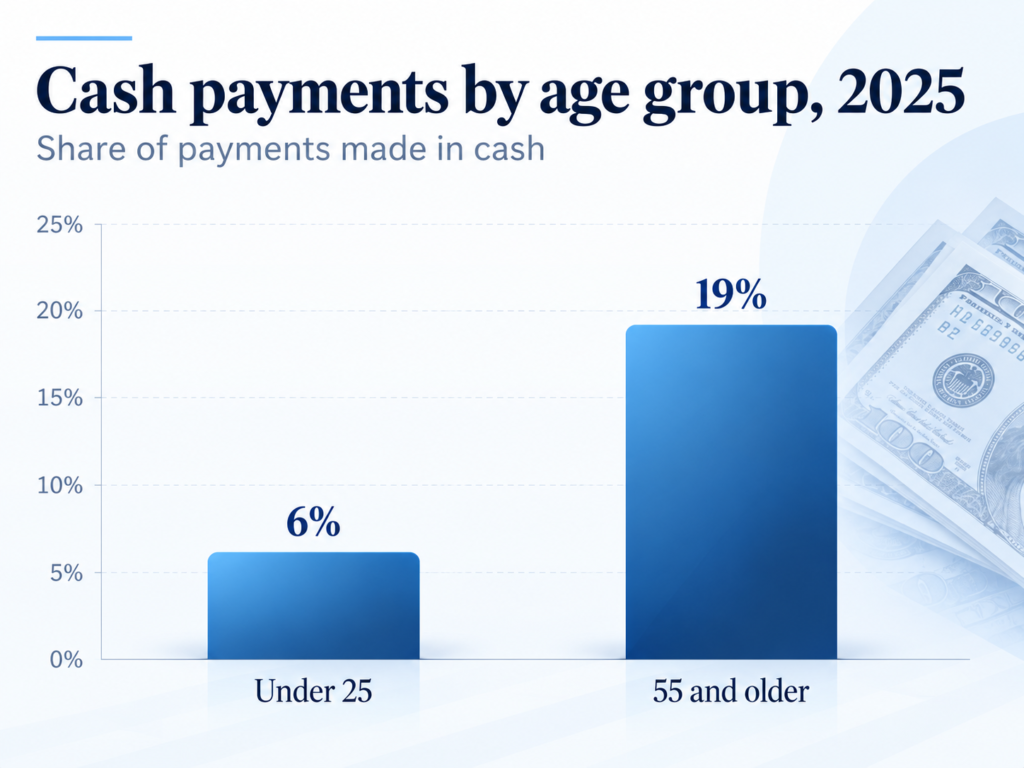
- Adults 55 and older made about 10 cash payments a month, or 19% of their payments, while those under 25 made about two, or 6%.
- People in households earning under $100,000 paid cash for roughly 17% of payments, versus about 9% above it.
- Rural residents averaged nine cash payments a month, compared with six in cities and suburbs.
- Five of six cash payments were under $25.
- About 76% carried cash, averaging $69, and 45% kept an average of $364 stored elsewhere.
For families living near what the median household income actually buys, cash works as a spending limit that charges no interest.
Paying by Card Is Not the Same as Borrowing
A rising credit card share sounds alarming until you separate swiping from borrowing. Plenty of people charge groceries and gas, then pay the full statement balance before any interest applies.
The Federal Reserve survey of household economic well-being found that 82% of adults had a credit card in 2025. Among cardholders, 45% carried a balance at least once in the previous 12 months, down 12 percentage points over the past decade.
Income changes that picture. Among cardholders with family income under $25,000, 52% carried a balance, compared with 37% of those earning $100,000 or more.
Card Balances and Interest Rates Remain High
Balances show the borrowing side of the story.
The New York Fed household debt report for the second quarter of 2026 put credit card balances at $1.263 trillion, up $21 billion from the first quarter.
On an annualized basis, 6.97% of card balances moved into serious delinquency, meaning 90 or more days late, compared with 6.93% a year earlier.
Rising credit card balances have also raised concerns about the risks facing borrowers and banks. The video below explores these concerns and examines how financial institutions are responding to growing credit card debt.
Interest is where the real cost sits. The Federal Reserve consumer credit release dated October 7, 2026 shows an average rate of 22.36% in August 2026 on accounts that were charged interest, and 21.19% across all accounts. Both are preliminary figures and may be revised.
The shift in how Americans pay has not made carrying a balance any cheaper. Card interest rates remain near 20%, and nothing in the newest release changes that.
The long-term cost becomes clearer when you look at five years of minimum credit card payments. My calculation shows how much can go toward interest while a substantial balance remains unpaid.
What Card Fees Look Like From a Small Business Ledger
For local tradespeople and small service companies, card processing shows up on bank statements as fees taken out of deposits. A job paid by card never arrives in full.
The Richmond Fed puts interchange fees, the part paid to the bank that issued the card, at 1% to 3% of a transaction. Total merchant fees typically run 1.5% to 3.5%.
- On a $1,000 repair job, fees of 1.5% to 3.5% come to $15 to $35.
- Many shops fold that cost into their prices, and some post a separate cash price or add a card surcharge.
- Research from the Kellogg School of Management argues that merchant fees help fund card rewards, so cash and debit users may cover part of that cost through prices, a modeled finding rather than a measured bill.
No Federal Rule Requires Stores to Take Cash
Questions about weekly habits show the same shift from another angle.
A Pew Research Center survey from August 2026 found that 42% of adults use no cash for any purchases in a typical week, up from 24% in 2015. Only 12% use cash for all or almost all purchases, half the 2015 share.
Did you know? US bills and coins are legal tender for debts, yet no federal law requires a private business to accept them at the register.
The Federal Reserve answer on refusing cash leaves that question to state law, and a state law can require it.
Cash still has a job. Four in five people used it in the previous 30 days, according to the Federal Reserve release, and it keeps working when the card reader goes down at the worst moment.
Check What Your Card Actually Costs You
Consider a hypothetical household that puts $2,500 a month of groceries, gas, and utilities on a card paying 1.5% back.
The rewards come to $37.50 a month. If the same household carries a $3,000 balance at the 22.36% average rate, interest runs about 55.90 a month (3,000 times 22.36%, divided by 12).
Issuers use daily balances, so real figures differ slightly.
In that example, the balance turns the rewards into a loss of about $18 a month. Paying in full flips the result back to a gain.
At the hardware store, the drawer had to balance before I could leave. A card statement deserves the same check.
Find two lines on your latest one, interest charged and rewards earned, and compare them.
If interest is the larger number, paying down the balance will do more for your budget than any points offer.