
A record income sounds reassuring until you start assigning it jobs. Housing gets the first share. Groceries, transportation, and insurance line up behind it. By the time everyone has been paid, the record can feel surprisingly ordinary.
The Census Bureau puts median U.S. household income at $87,460 for 2025. In 2026, that income can cover everyday expenses and some saving, but housing, household size, and debt determine how much breathing room remains.
That last part interests us more than the headline. At your own kitchen table, the question is not how big the number looks. It is what survives the bills.
The record is real, but it describes last year

The Census release published September 15, 2026 reports a 2.6% increase from $85,210 in 2024, measured in comparable dollars. The $87,460 figure is the highest in the series dating to 1967.
Real income means inflation-adjusted income. The reported increase already accounts for price changes over the comparison period.
Calling the improvement meaningless because prices rose would miss that adjustment. Equally, calling it proof that everyone feels comfortable would stretch the findings.
Median means half of households fall above the midpoint and half below. It isn’t an individual salary. Two earners making $44,000 and $43,460 together reach $87,460 before taxes.
The distinction shows up in everyday life. Two paychecks can support one household, but they can also bring two commutes and competing schedules. The total does not explain the arrangements behind it.
The monthly number isn’t your bank deposit
Dividing $87,460 by twelve gives $7,288.33 monthly before taxes. I wouldn’t build a spending plan around that number.
The full Census income report separately estimates median post-tax household income at $76,060, or $6,338.33 monthly. That measure accounts for federal and state taxes and credits, plus payroll taxes.
It isn’t a promise that every household earning $87,460 takes home $76,060. Comparing two national medians doesn’t produce anyone’s personal tax calculation.
Payroll work taught me to follow the money all the way to the bank. Take a hypothetical household earning $7,288.33 monthly before deductions. If its pay stubs show $1,200 withheld for taxes, $400 for retirement contributions, and $300 for health insurance, the amount deposited is $5,388.33.
Those are illustrative deductions, not a tax estimate. Another household earning the same amount could receive a different deposit because its insurance costs, retirement contributions, or tax withholding differ. Filing status and eligible child-related tax credits can affect withholding, too. That’s why I’d build the grocery budget around the deposit, not the salary.
The gap between headline numbers and actual earnings is also visible in Meta’s Louisiana data center jobs, where thousands of construction positions are expected to give way to a much smaller permanent workforce.
The same calculation matters when considering a shorter schedule. As our look at whether a four-day workweek is worth a pay cut explains, fewer working hours can mean more personal time but less money available for monthly expenses.
For a household budget, start with actual deposits and identify what has already been deducted. Otherwise, it’s easy to count a health premium twice or treat retirement contributions as spendable cash.
The 2026 price increases reach different households differently

The latest available August 2026 consumer price report, released September 11, shows prices rising 3.4% over twelve months.
Within that total:
- Groceries rose 2.2%.
- Shelter rose 3.0%.
- Gasoline rose 27.4%.
Those increases don’t mean every family needs exactly 3.4% more income. A long commute creates different exposure from working at home. Renters and homeowners also face different bills.
Fuel is harder to negotiate when a trip is necessary. Changing dinner plans doesn’t shorten the drive.
One way to bring more structure to food spending is the 5-4-3-2-1 grocery shopping method. It limits the number of different items on your list, although the final savings still depend on prices, quantities, and what you already have at home.
Nor should we subtract 2026’s inflation rate from 2025’s real income growth. They cover different periods. The income report establishes last year’s improvement, while current prices help explain the pressure on money being spent now.
What a family budget could look like
Here is an illustrative Ohio household with two adults, two school-age children, and $87,460 in gross income. Assume $6,000 reaches its bank account monthly after taxes and payroll deductions. That’s a chosen scenario, not a calculated tax estimate or some family’s actual spending.
| Monthly allocation | Amount |
|---|---|
| Rent and renters insurance | $2,200 |
| Utilities, internet, and phones | $350 |
| Groceries | $950 |
| Car payment, fuel, and insurance | $750 |
| Healthcare beyond payroll deductions | $350 |
| Other debt payments | $300 |
| Clothes, school costs, and recreation | $400 |
| Savings and repair reserves | $500 |
| Total allocated | $5,800 |
| Remaining | $200 |
The figures are assumptions, not local averages. Paid childcare is excluded. They show a family covering bills and setting money aside, with little unassigned cash.
A $600 repair would use up three months of that leftover amount, so the repair reserve has a real job.
Housing and childcare can rewrite the whole result
Keep that household’s income unchanged and alter just two assumptions. The budget tells a different story before anyone changes a grocery habit.
- Lower housing costs from $2,200 to $1,600, and the monthly remainder rises from $200 to $800.
- Add a hypothetical $1,200 childcare bill to the original budget, and the household faces a $1,000 monthly shortfall.
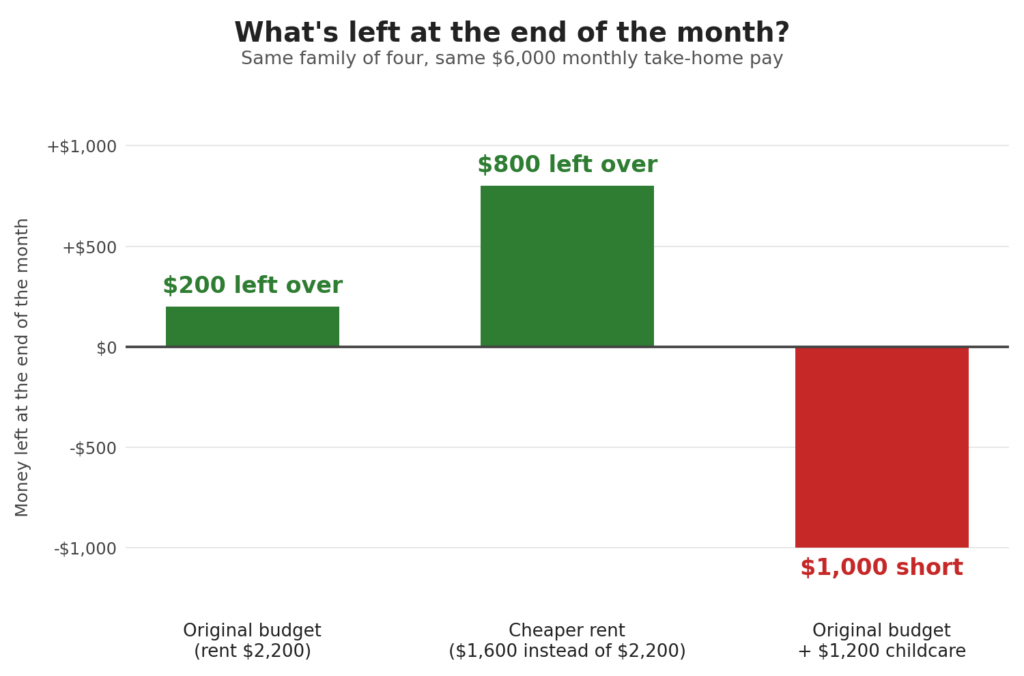
Neither figure is a quoted market price. They’re examples of how existing commitments change what the same income buys.
Location can change the equation, too. Tulsa, Oklahoma, offers eligible remote workers $10,000 to relocate, but our look at why many stay after the first year shows that lower housing costs may matter more than the initial payment.
Marriage, children, and homeownership broadens how we think about affordability. A monthly payment is only part of the arrangement. Repairs, care schedules, and the cost of getting to work belong in the conversation too.
We wouldn’t look at that childcare shortfall and start lecturing someone about coffee. The larger commitments need attention first. Small savings can help, but the arithmetic sets their limits.
Check what your own income is already committed to

Keeping savings while carrying a credit card balance can feel organized. Calculating the interest cost makes the arrangement look less impressive.
The same logic applies to an income headline. The amount coming in deserves attention alongside the obligations attached to it.
The same question follows households into retirement, when a mortgage payment can outlast the paycheck and continue taking a share of monthly income.
The calculation becomes especially important after retirement. Even in states where $2,000 a month stretches further, Medicare premiums, housing, and everyday expenses can leave surprisingly little room in the budget.
A household budget review can follow this order:
- Compare actual monthly deposits with housing, utilities, food, and essential transport.
- Convert annual bills and predictable repairs into monthly amounts.
- List debts by balance, interest rate, and minimum payment.
- Check what remains after existing savings and retirement contributions.
A higher salary can improve the picture, but an unchanged bank balance needs investigation. The useful question is which expense increased, which deduction changed, or which occasional bill never made it into the plan.
Some household expenses also extend beyond the years when children live at home. Parents who continue helping adult children financially may find that those payments take up a meaningful share of their monthly budget.
Frequently asked questions
The number We would put beside the headline
For us, the most useful companion to $87,460 is the amount left after a household has covered its commitments and allowed for bills that arrive irregularly.
In the example above, that is $200 after a $500 savings and repair allocation. Change housing or childcare, and the answer changes sharply. A national record cannot settle that question for an individual family.
Open the last three months of bank statements, check the deposits, and give the annual bills a monthly line. Then put the remaining amount beside the income figure. That is the money available for the next decision.