Open a 401(k) statement after a strong quarter, and the first reaction is often suspicion. Did someone make a mistake? Usually the answer is the stock market.
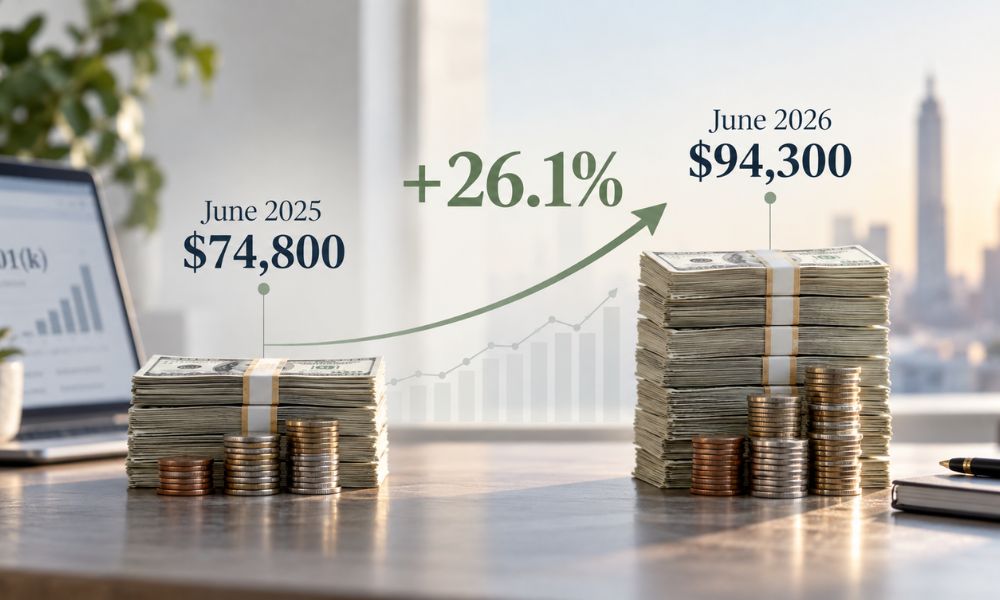
The average millennial 401(k) balance reached $94,300 at the end of June, up 26.1% from a year earlier, according to the second-quarter 2026 retirement numbers from Fidelity.
Before anyone celebrates or worries, it helps to know what that figure measures and how much of the gain came from savers themselves.
What the Fidelity Report Shows About the Average Millennial 401(k) Balance
Fidelity published its Q2 2026 retirement analysis on September 3, 2026.
The 401(k) figures cover about 25.8 million participants in 27,300 corporate plans, with balances measured as of June 30, 2026.
Fidelity also tracks 403(b) plans and IRAs, but the 26.1% millennial figure refers to 401(k) accounts only.
| Group | Average 401(k) balance | Employee contribution rate |
|---|---|---|
| Baby boomers | $283,200 | 12.2% |
| Gen X | $240,700 | 10.6% |
| Millennials | $94,300 | 9.0% |
| Gen Z | $20,800 | 7.6% |
| All participants | $155,800 | 9.6% |
The generational breakdown comes from Newsweek coverage of the same data. The Pew Research Center defines millennials as people born from 1981 through 1996, so the group is now roughly 30 to 45 years old. Fewer working years and lower salaries explain most of the distance between the average millennial 401(k) balance and the Gen X figure.
Where a 26% Jump Comes From

A 26% increase sounds as if millennials suddenly began saving a quarter more. They did not. A year-over-year change in an average balance has three main sources.
- New money from paychecks and employer matches, which keeps arriving every pay period whether markets rise or fall.
- Investment gains or losses on money already in the account, which depend almost entirely on the markets.
- Changes in who is counted, because workers switch jobs, roll accounts out, or join a new plan with a small starting balance.
The third source rarely makes headlines. A generational average is not the same set of accounts tracked from one June to the next, so part of any change reflects the mix of people inside the sample.
Fidelity does not separate those three effects, which is why we ran our own rough math further down.
Stocks Did Much of the Lifting
The 12 months ending June 30, 2026, were strong ones for stocks.
According to the S&P Dow Jones Indices performance dashboard, the S&P 500 delivered a 22.32% total return over that period, including 15.20% in the second quarter alone.
The year didn’t start smoothly. The index was up only 10.21% for the first half of 2026, which works out, by my math, to a first-quarter loss of roughly 4%.
Fidelity reported that the millennial average then rose about 14% between March and June, a gain that tracks the market rebound far more closely than any change in saving habits.
A total return counts price changes plus reinvested dividends. A 401(k) statement works the same way, so the balance moves with the market even in months when your contributions stay exactly the same.
How a Sample Millennial 401(k) Balance Grew
To see how the pieces fit, we built a hypothetical example. It is not a real account.
Working backward from the 26.1% increase, the June 2025 millennial average would have been about $74,800.
We, then, assumed a millennial earning $68,000 a year who contributes the 9.0% generational average and receives the 4.8% average employer contribution Fidelity reported across all participants.
| Hypothetical example | Amount |
|---|---|
| Starting balance, June 2025 | $74,800 |
| Employee and employer contributions (13.8% of $68,000) | $9,384 |
| Investment growth (the remainder) | $10,116 |
| Ending balance, June 2026 | $94,300 |
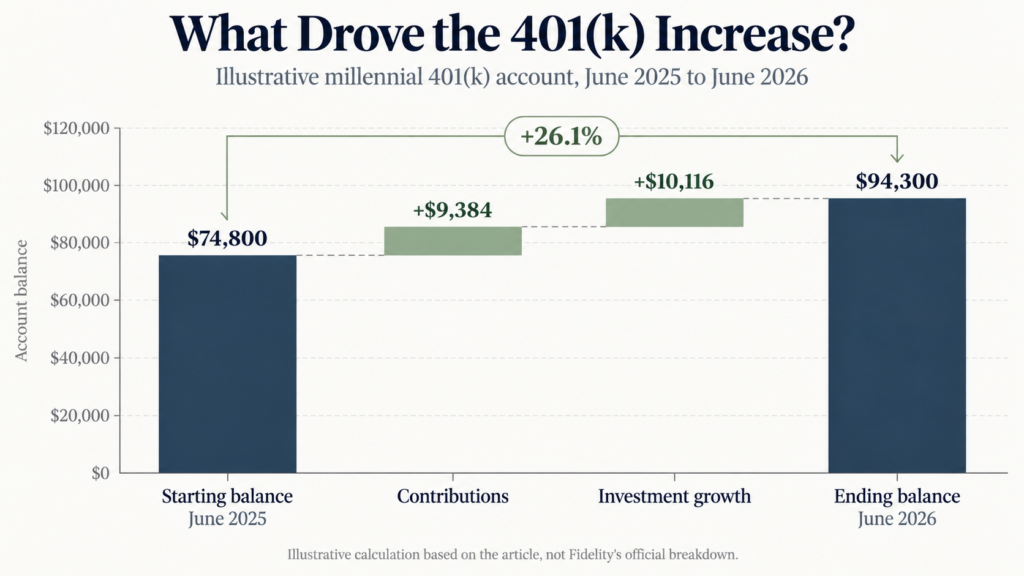
In that example, contributions explain about 12.5 percentage points of the increase and investment growth explains the rest.
Your split will differ with salary, match, and stock allocation.
We keep those two columns separate in my household spreadsheet, because a good year for the market is not something we can take credit for.
Why Younger Savers Post Bigger Percentage Gains
Across all Fidelity participants, the average 401(k) rose about 13% over the same 12 months, to $155,800. Millennials gained roughly twice that in percentage terms, and the reason is arithmetic more than skill. A smaller balance makes every paycheck contribution count for more.
- A year of contributions worth $9,000 adds about 12% to a $75,000 account.
- The same $9,000 adds less than 4% to a $240,000 account, close to the Gen X average.
Older savers also tend to hold more bonds as retirement approaches, which softens both losses and gains.
A 26% figure for millennials and a smaller one for boomers does not mean millennials picked better investments.
Mostly, the average millennial 401(k) balance started from a lower base, and steady contributions moved it faster in percentage terms.
The Average Hides the Typical Saver
Averages get pulled upward by large accounts. A few savers with $400,000 balances can lift the figure for a group in which many people hold $15,000. The median, the account in the exact middle, usually tells you more about an ordinary saver.
The Vanguard report How America Saves 2026 shows the gap clearly. Across Vanguard plans at the end of 2025, the average balance was $167,970, while the median was $44,115. Half of participants held less than that median.
The gap between average and median retirement savings becomes even clearer when balances are broken down by age.
The following Instagram video illustrates how dramatically those figures differ across generations.
View this post on Instagram
Did You Know?
Fidelity counted 769,000 401(k) millionaires in the second quarter of 2026, and millennials made up about 6% of that group. The average 401(k) millionaire was 58 years old and had been saving for about 25 years, a reminder that time in the plan matters as much as any single strong year.
A Late Start, and the Paycheck Math That Helps
Many millennials began their careers as the 2008 recession was spreading. A Yahoo Finance review of millennial retirement savings notes that unemployment among young workers approached 15% in that period. Many millennials began saving late, and many saved small.
One detail makes saving more less painful than it looks. A traditional pre-tax 401(k) deferral lowers taxable income, so a $200 contribution might cut take-home pay by roughly $150 to $175, depending on tax bracket and state.
Seeing that math can make it easier to raise a contribution rate far enough to capture the full employer match. Lowering it again after a rent increase is an understandable choice too. A smaller contribution that lasts beats a larger one that gets dropped.
Warning Signs Inside the Same Report
Strong averages and household strain can show up in the same set of numbers. Several figures from the second quarter deserve as much attention as the 26% headline.
- About 19.5% of participants had an outstanding 401(k) loan, according to a Plan Sponsor Council of America summary of the Fidelity data.
- Hardship withdrawals reached 3% of participants, up from 2.6% a year earlier.
- About 18.8% of participants did not save enough to receive their full employer match.
- Part of the gain depends on a quarter in which stocks rose 15%, and the first quarter of 2026 showed how fast a weaker stretch can reverse gains.
Feeling responsible and being efficient are not always the same thing. Skipping part of an employer match is a good example. The paycheck looks a little bigger, but the free money left behind is gone for good.
What to Check on Your Own Statement
A national average cannot tell you whether your own account is on track.
Your statements can show where your growth came from, and the check takes about 20 minutes with two documents and a calculator.

- Find your statement dated June 30, 2026, and the one from June 30, 2025.
- Add up your own contributions and the employer match for those 12 months. A pay stub shows year-to-date deferrals if the statement does not.
- Subtract both amounts from the change in your balance. What remains is investment growth or loss.
- Confirm that your rate captures the full match. The most common formula in Fidelity plans matches 100% of the first 3% of pay and 50% of the next 2%.
- Compare your contributions with the 2026 IRS limit of $24,500 for employee deferrals.
If Your Balance Grew Less Than 26%
If your account grew far less than 26%, you did not necessarily do anything wrong.
A job change, a loan, or a cash-heavy allocation would produce a very different year.
Run the subtraction in the list above, then look at one number only, your contribution rate.
A move from 6% to 7% on a $68,000 salary costs about $680 a year before taxes, roughly $26 per biweekly paycheck, and it keeps working in years when the market gives nothing back.
Housing costs can follow people into retirement, as I covered in a piece on retiring with a mortgage still to pay, and an extra percent now buys room later.